
- Help Center
- Practice IQ
- Production
-
Getting Started
-
Users and Login Information
-
Templates and Messages
-
Schedule and Online Appointment Booking
-
Patient Information
-
Online Forms
-
Reputation
-
Practice IQ
-
Revenue IQ
-
Tasks
-
Phone IQ
-
Marketing IQ
-
Patient Flow
-
Payments
-
PBN Settings
-
Enterprise Pages
-
Eaglesoft Best Practices
-
Open Dental Best Practices
-
Dentrix Best Practices
-
Product Releases
-
Known and Resolved Issues
-
Additional fees and overages
-
PBN Apps
-
Insurance Verification
-
FAQ's
-
Patient Portal
Production by time of the day
Production by time of the day and by day of the week.
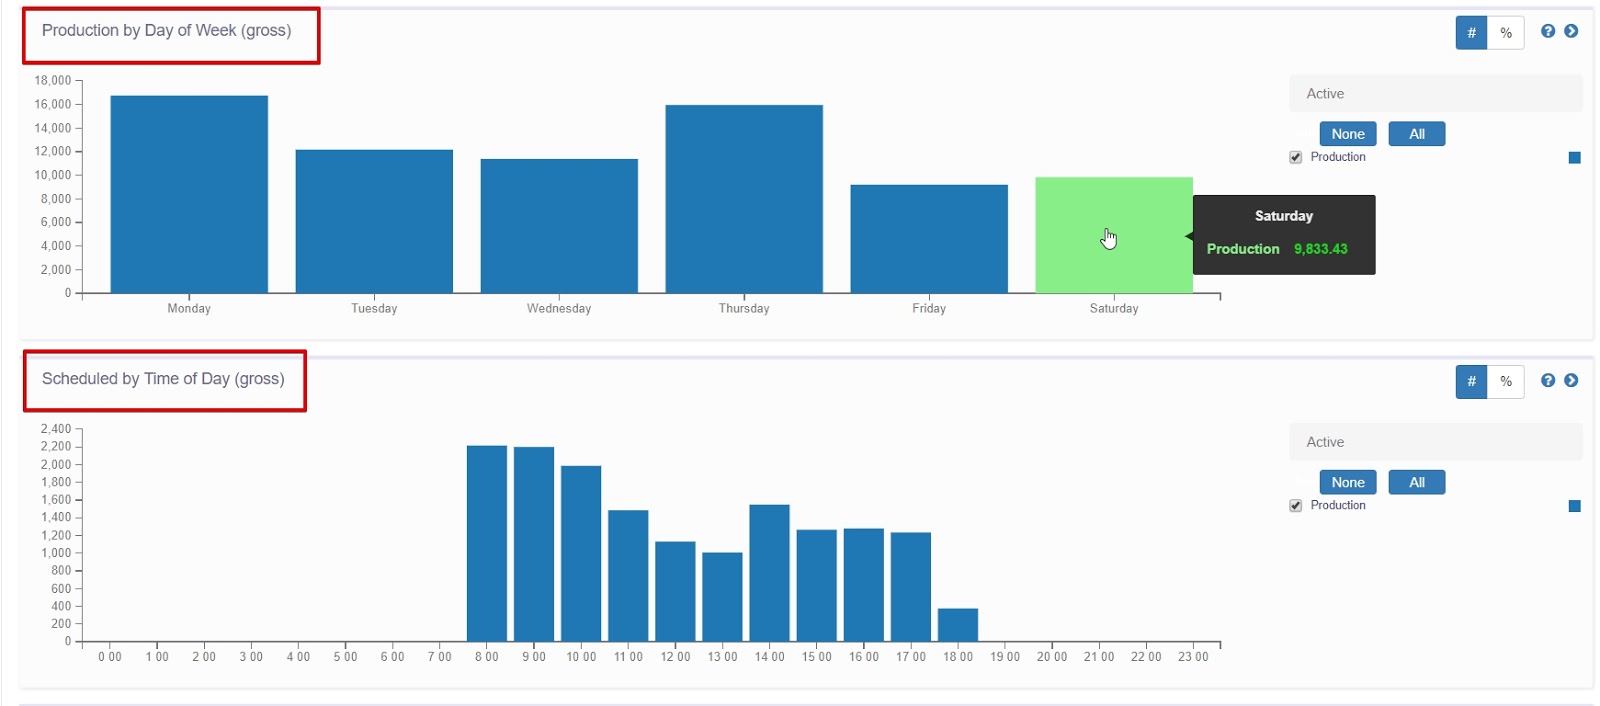
Go to the “Financial” - “Production Details” dashboard, in there scroll down to find two bar graphs:
-
Production by Day of Week (gross): this bar graph tells you which day of the week is most productive.
-
Scheduled Production by Time of Day (gross): this bar graph gives you hourly breakdown of production scheduled can help you analyze your most and least productive hours in a day.
Like any other page, you can change the time period at the top of the page to get a better overall view of those numbers. To get better averages you can open the time window to at least 12 months so you have some averaging.
You may also like to see this article: