- Help Center
- Practice IQ
- How to read graphs?
-
Getting Started
-
Users and Login Information
-
Templates and Messages
-
Schedule and Online Appointment Booking
-
Patient Information
-
Online Forms
-
Reputation
-
Practice IQ
-
Revenue IQ
-
Tasks
-
Phone IQ
-
Marketing IQ
-
Patient Flow
-
Payments
-
PBN Settings
-
Enterprise Pages
-
Eaglesoft Best Practices
-
Open Dental Best Practices
-
Dentrix Best Practices
-
Product Releases
-
Known and Resolved Issues
-
Additional fees and overages
-
PBN Apps
-
Insurance Verification
-
FAQ's
-
Patient Portal
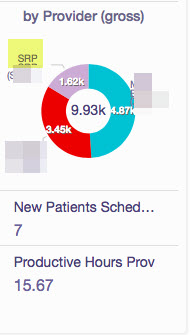
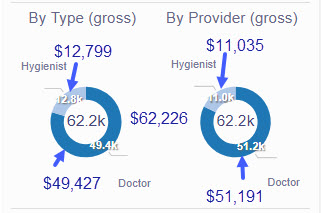
Why are these production graphs different?
The Production Drilldown graphs show the same total amount but are classified differently regarding Hygiene and Doctors.
Users might have noticed why the drill-down visuals in the Home-Production panel have different dollar totals when categorized.
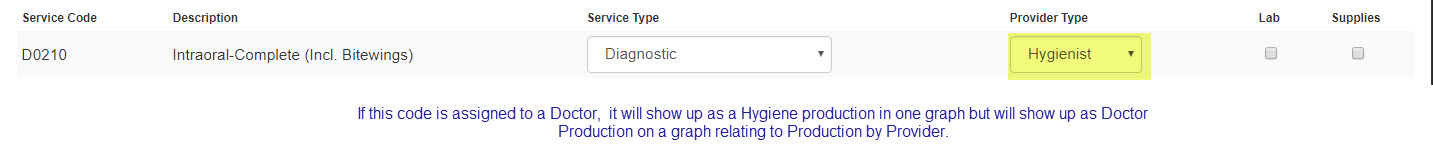

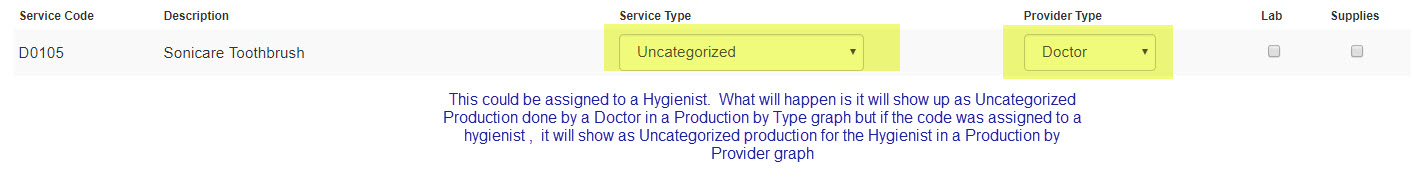
If desired, the Provider Type can be changed via the drop-down menu in the Settings- Code Settings page.
In addition, some offices will have created a "virtual" provider in their PMS software where procedure codes can end up being assigned to a non-existent Doctor vs who should get the production credit. But that amount would have been shown as Doctor production in a Production by Type graph.