
- Help Center
- Practice IQ
- Finding KPIs & Dashboards in PracticeIQ
-
Getting Started
-
Users and Login Information
-
Templates and Messages
-
Schedule and Online Appointment Booking
-
Patient Information
-
Online Forms
-
Reputation
-
Practice IQ
-
Revenue IQ
-
Tasks
-
Phone IQ
-
Marketing IQ
-
Patient Flow
-
Payments
-
PBN Settings
-
Enterprise Pages
-
Eaglesoft Best Practices
-
Open Dental Best Practices
-
Dentrix Best Practices
-
Product Releases
-
Known and Resolved Issues
-
Additional fees and overages
-
PBN Apps
-
Insurance Verification
-
FAQ's
-
Patient Portal
Practice IQ Advanced Pages
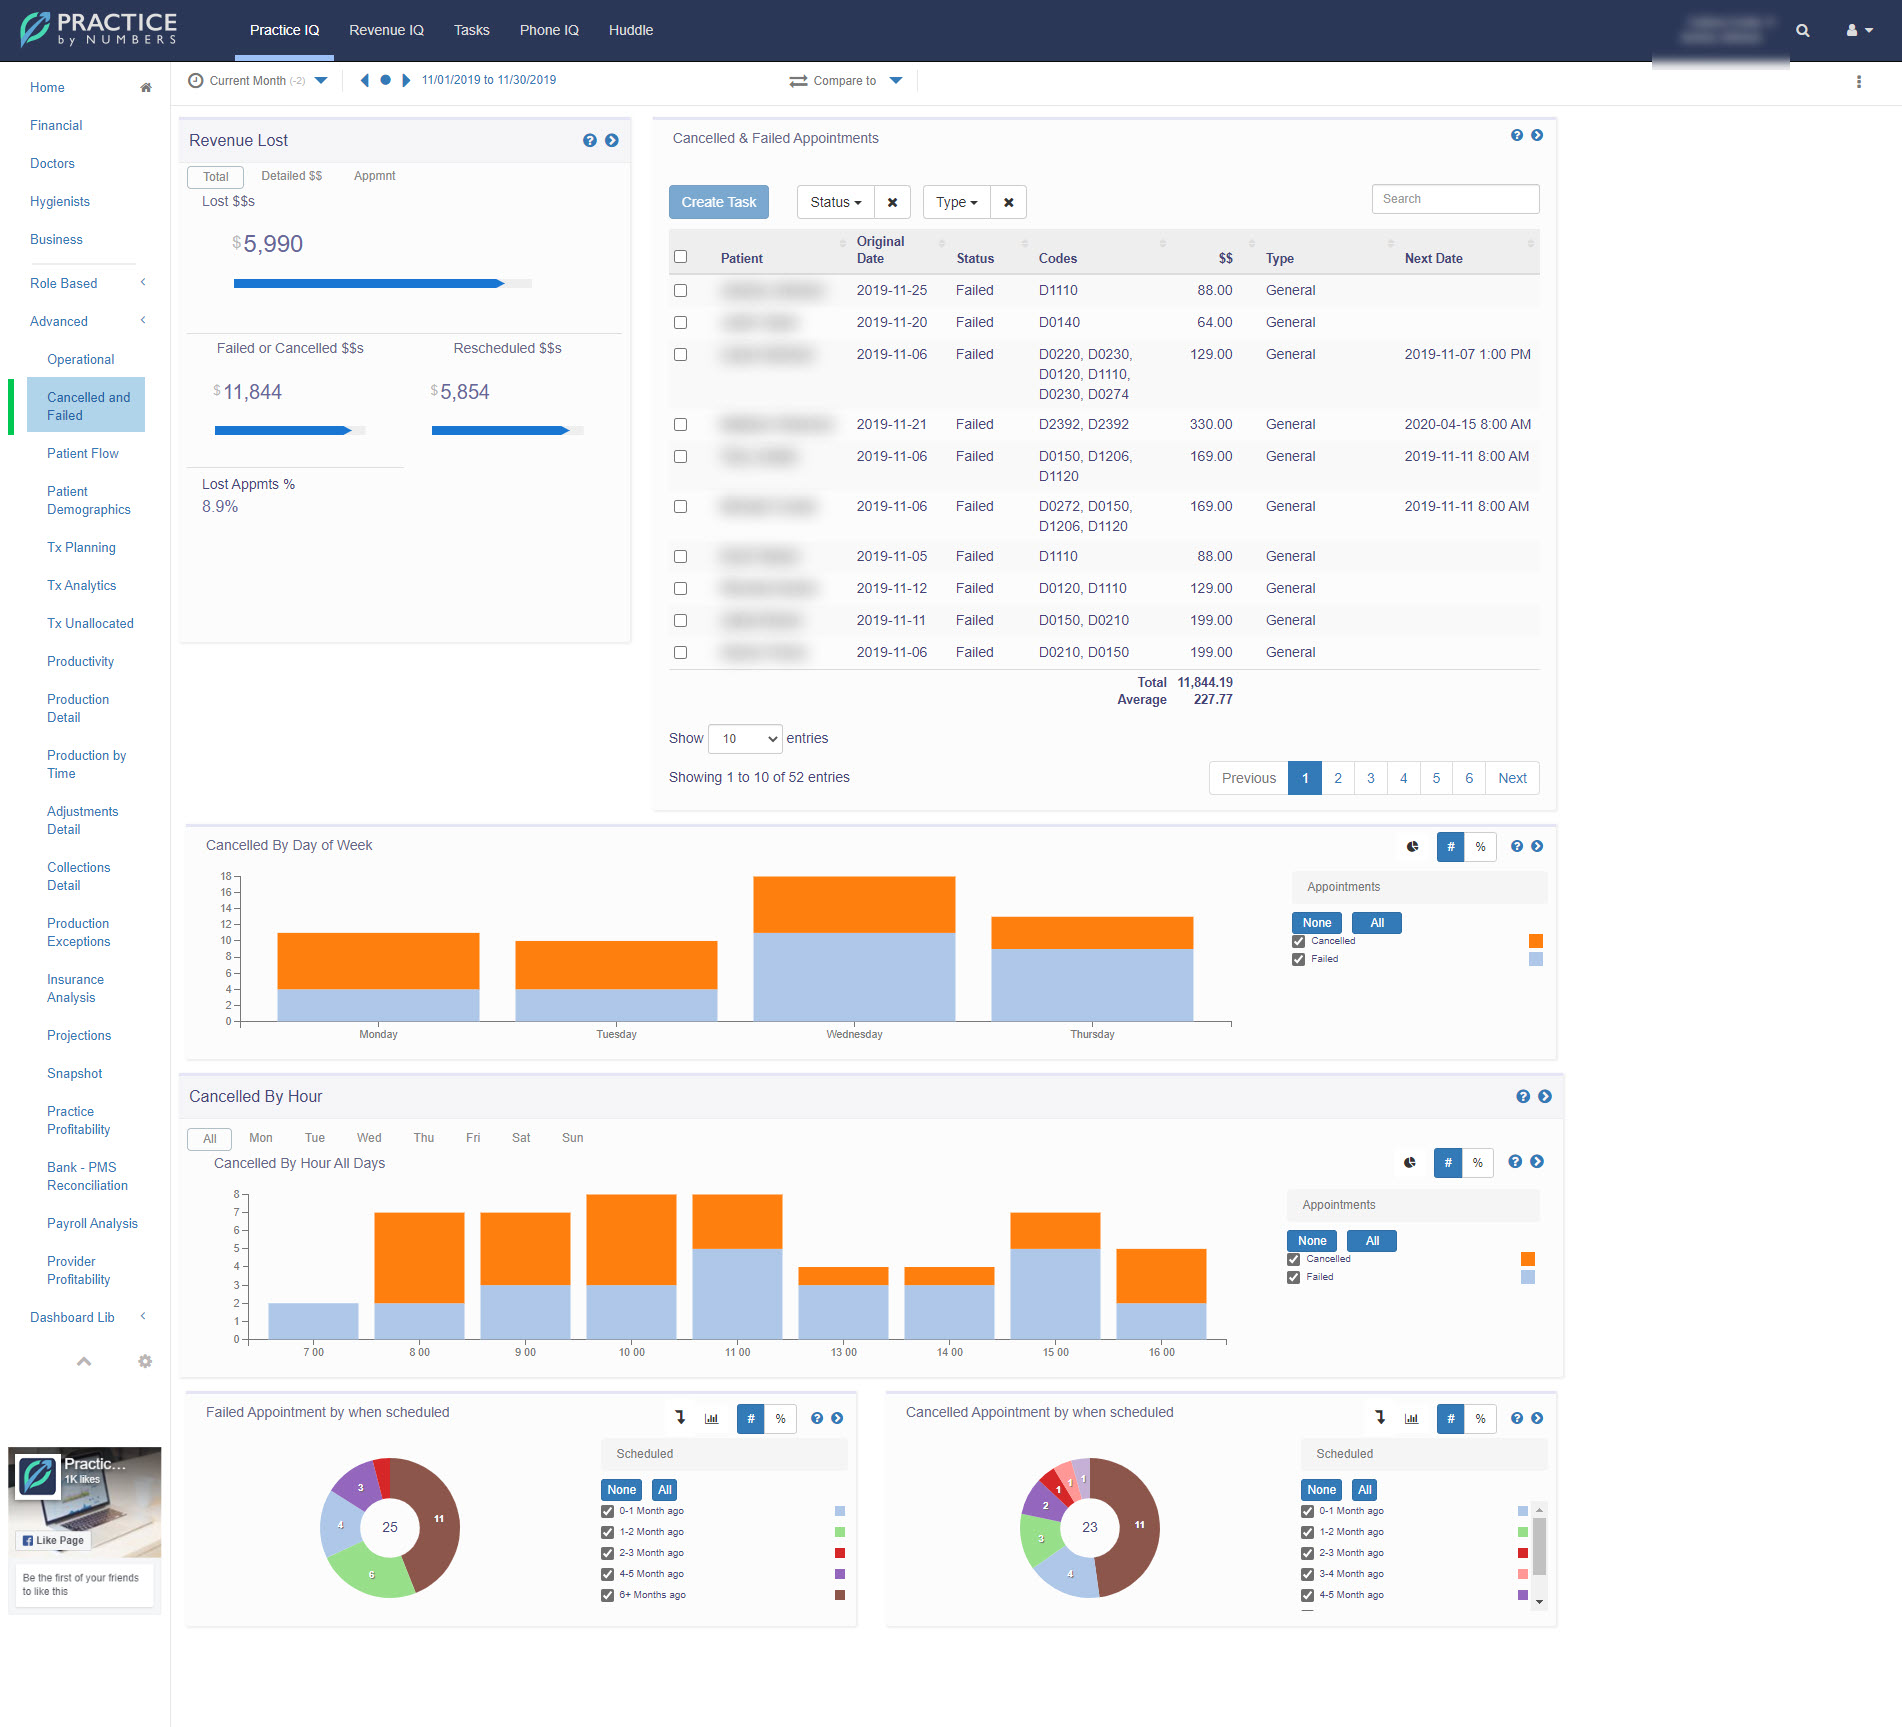
Cancelled and Failed
-
The Operational page still has information on this but this new page is exclusively on this topic.
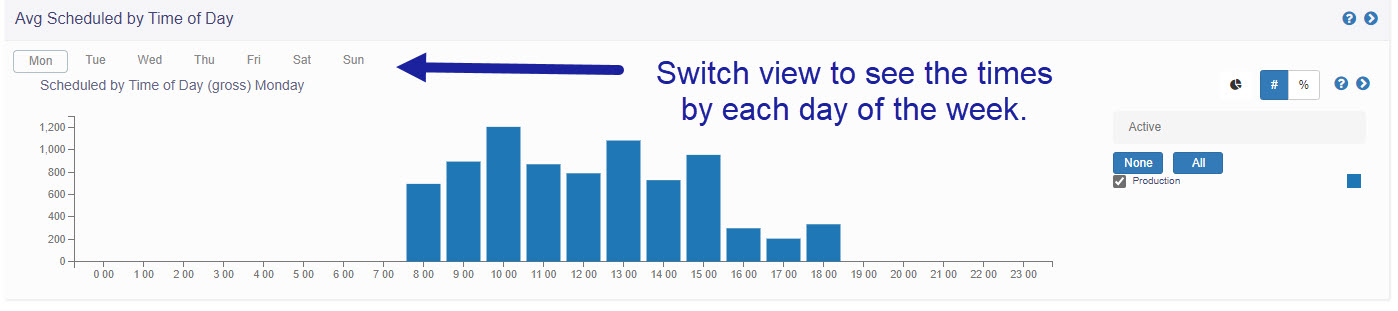
Production by Time
-
In the previous Production Details page you could see Production by Day of the Week and Time of the Day. In this new page the information goes deeper into Production by Time of Day for each day of the week.
Treatment Analytics
-
With this page you go deeper into what type of treatment is presented and accepted by exam types and providers. The visuals of the bar graph and can be changed to pie graphs, and there is the Show Data option to see the numbers in a table format.
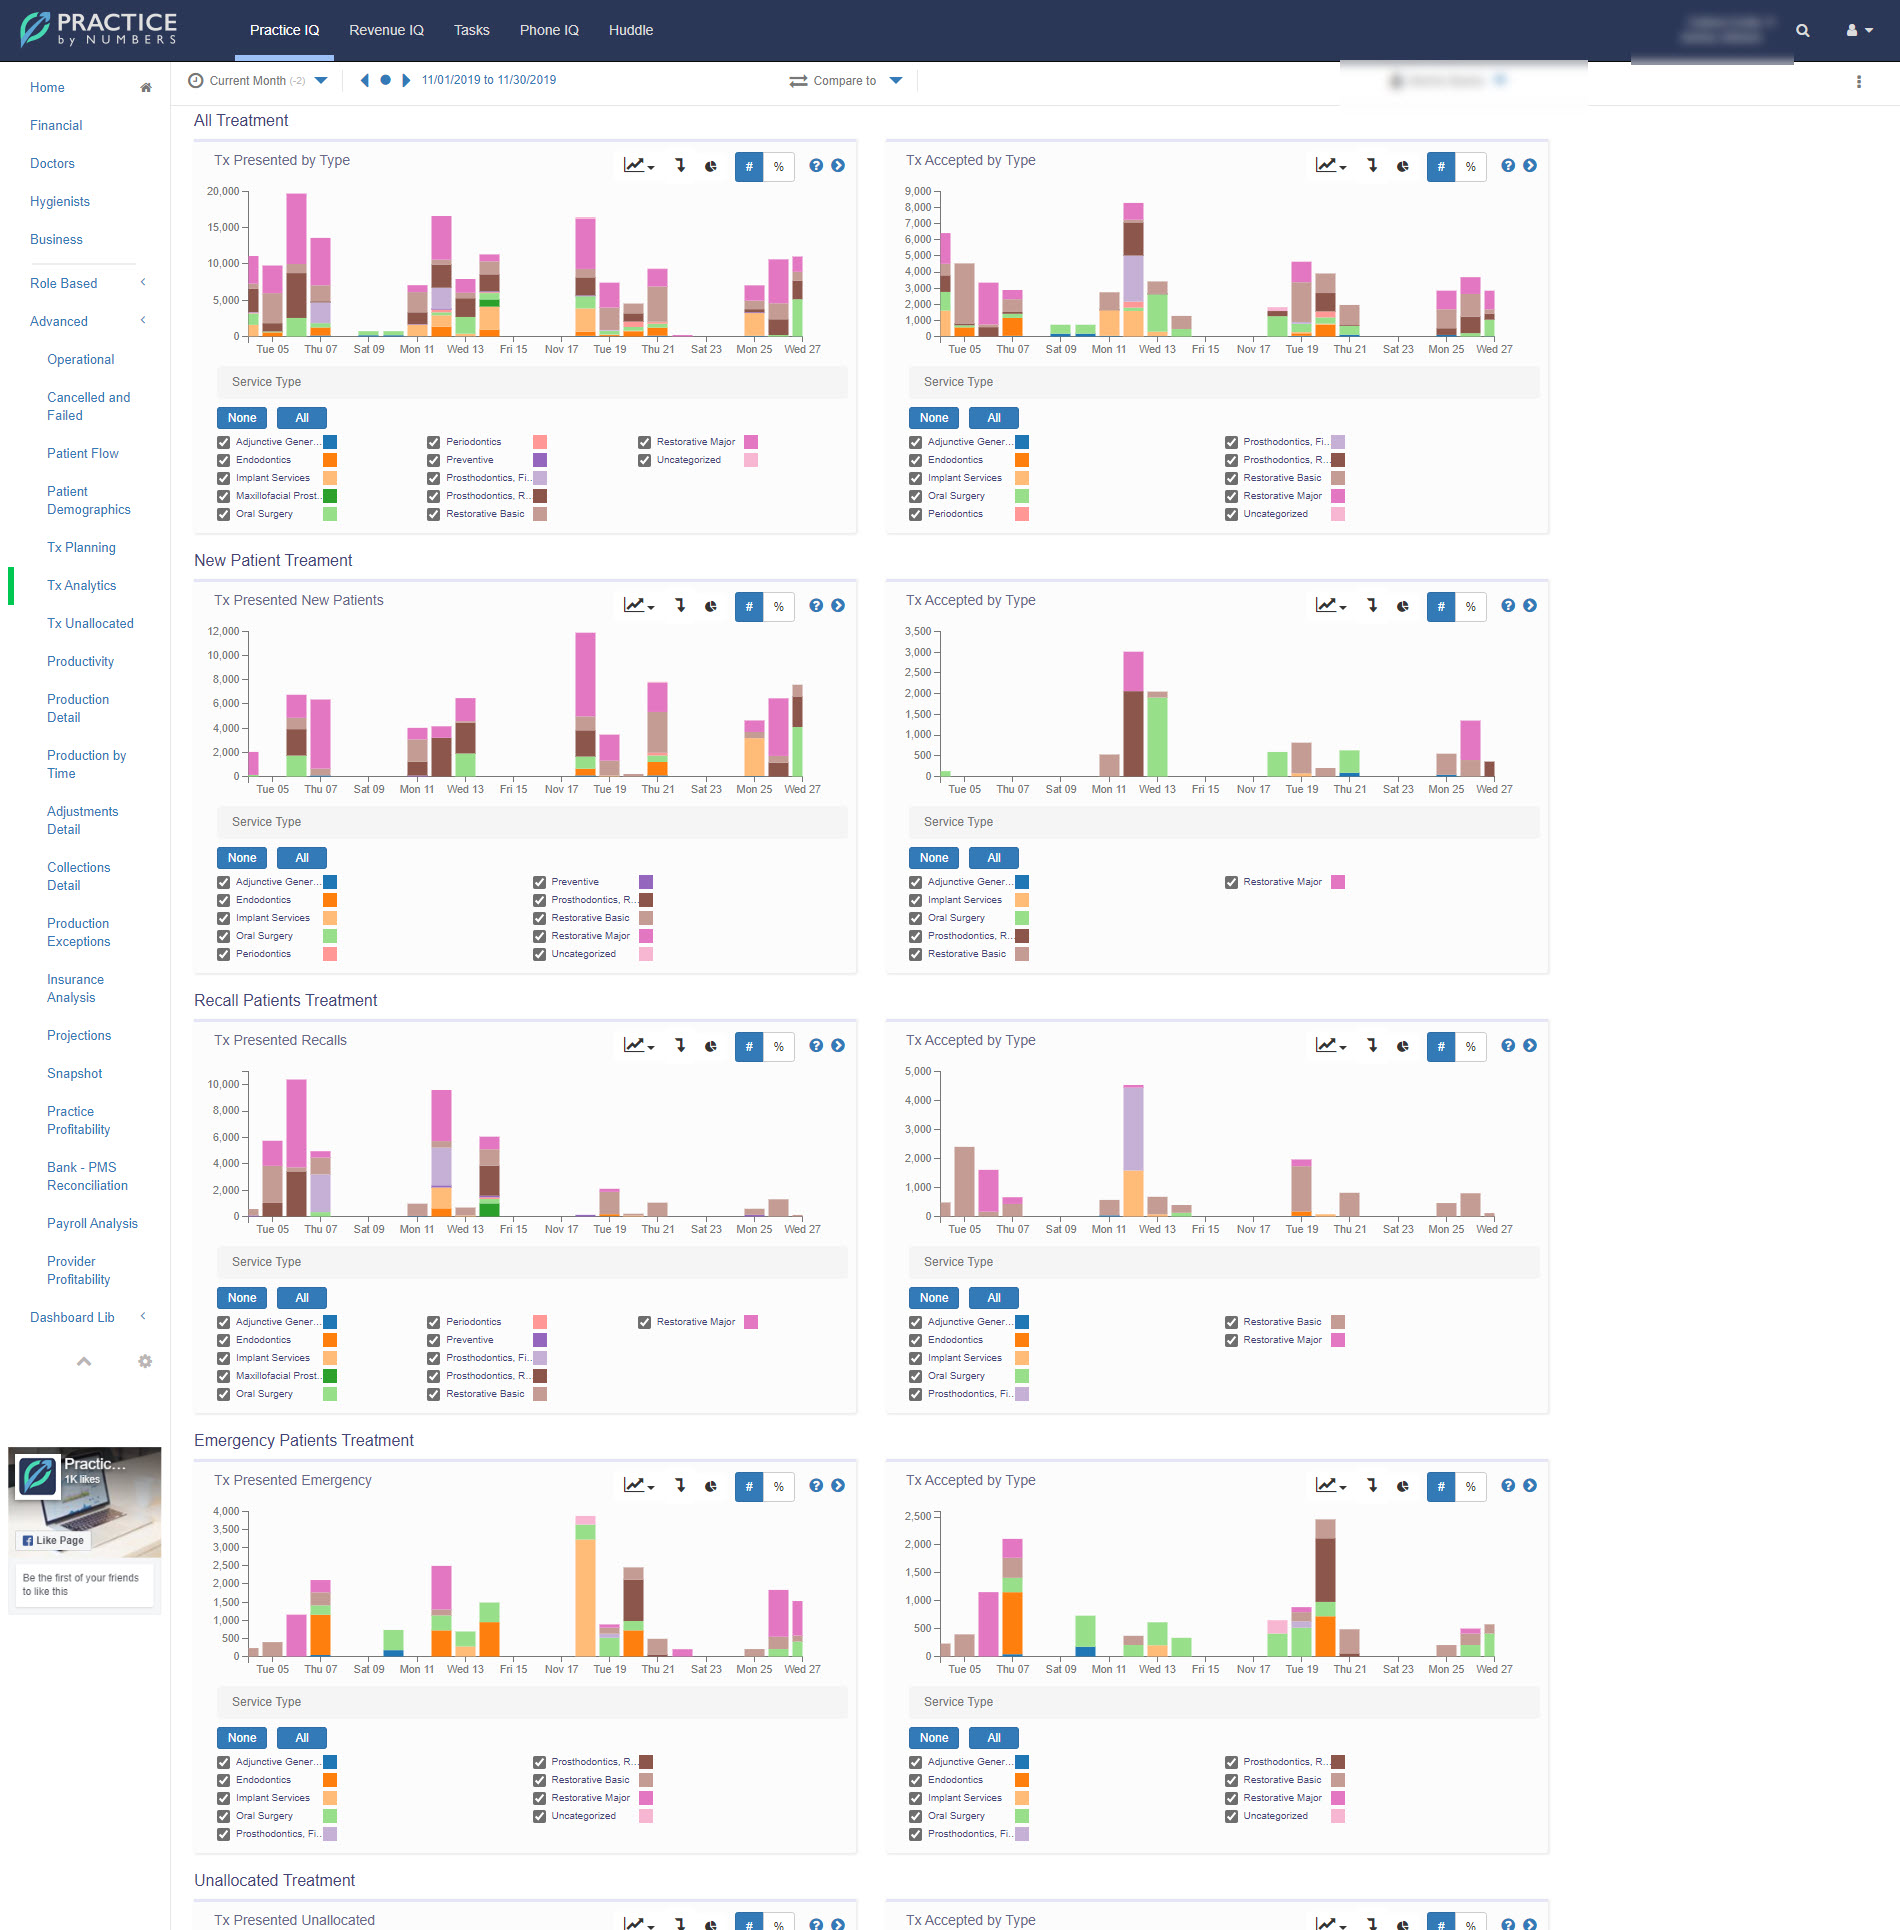

Production, Collection, and Adjustment Details now have line graphs of the top KPI's for that topic.
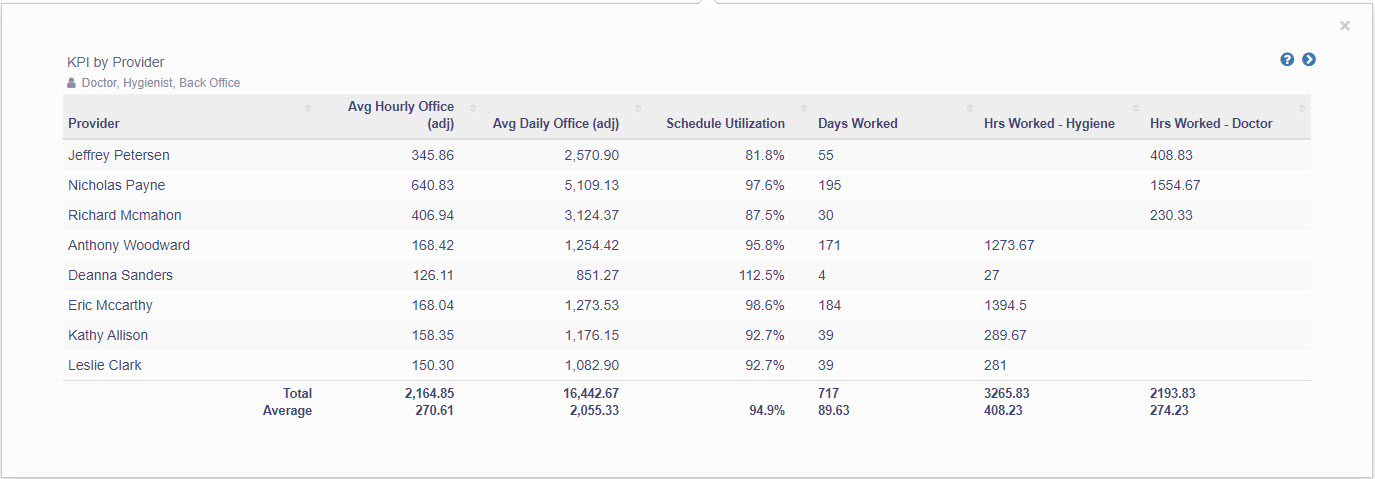
Productivity
-
This page is dedicated to information on Production per Patient, Hour and Procedure. Selecting the Provider icon in the panels will display further numbers by provider such as Production per Exam and Schedule Utilization numbers.
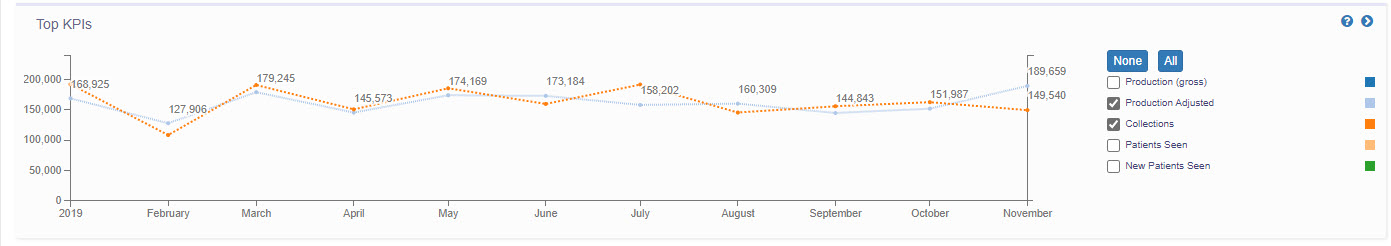
Snapshot
-
The Snapshot page displays top KPI histories for Production, Collection and Hygiene.