- Help Center
- Practice IQ
-
Getting Started
-
Users and Login Information
-
Templates and Messages
-
Schedule and Online Appointment Booking
-
Patient Information
-
Online Forms
-
Reputation
-
Practice IQ
-
Revenue IQ
-
Tasks
-
Phone IQ
-
Marketing IQ
-
Patient Flow
-
Payments
-
PBN Settings
-
Enterprise Pages
-
Eaglesoft Best Practices
-
Open Dental Best Practices
-
Dentrix Best Practices
-
Product Releases
-
Known and Resolved Issues
-
Additional fees and overages
-
PBN Apps
-
Insurance Verification
-
FAQ's
-
Patient Portal
KPI History Graph
How to see the history of a KPI.
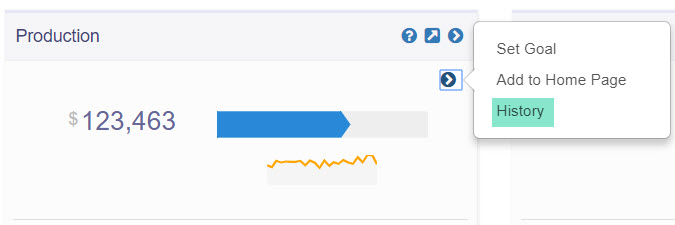
To see approximately 2.5 years of a particular KPI, hover the cursor to the upper right of the displayed number until a blue icon appears. When selected, there will be options to add to "Add to Home Page", "Set Goal", and "History". When History is selected a panel will open with a month-by-month bar graph of that KPI.

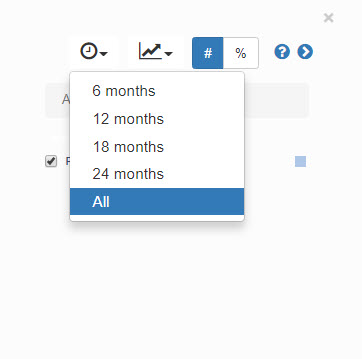
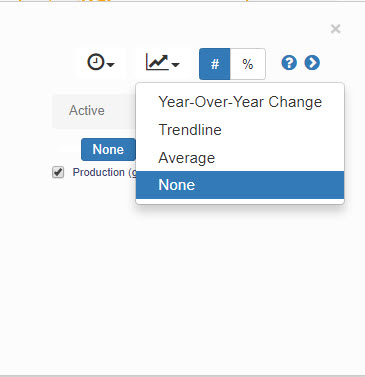
The actual number of the month can be viewed by hovering the cursor on that month. There are options to change the time period viewed, plus overlays of trend lines, an average line, and a year-over-year overlay plot.


