- Help Center
- Practice IQ
- How to read graphs?
-
Getting Started
-
Users and Login Information
-
Templates and Messages
-
Schedule and Online Appointment Booking
-
Patient Information
-
Online Forms
-
Reputation
-
Practice IQ
-
Revenue IQ
-
Tasks
-
Phone IQ
-
Marketing IQ
-
Patient Flow
-
Payments
-
PBN Settings
-
Enterprise Pages
-
Eaglesoft Best Practices
-
Open Dental Best Practices
-
Dentrix Best Practices
-
Product Releases
-
Known and Resolved Issues
-
Additional fees and overages
-
PBN Apps
-
Insurance Verification
-
FAQ's
-
Patient Portal
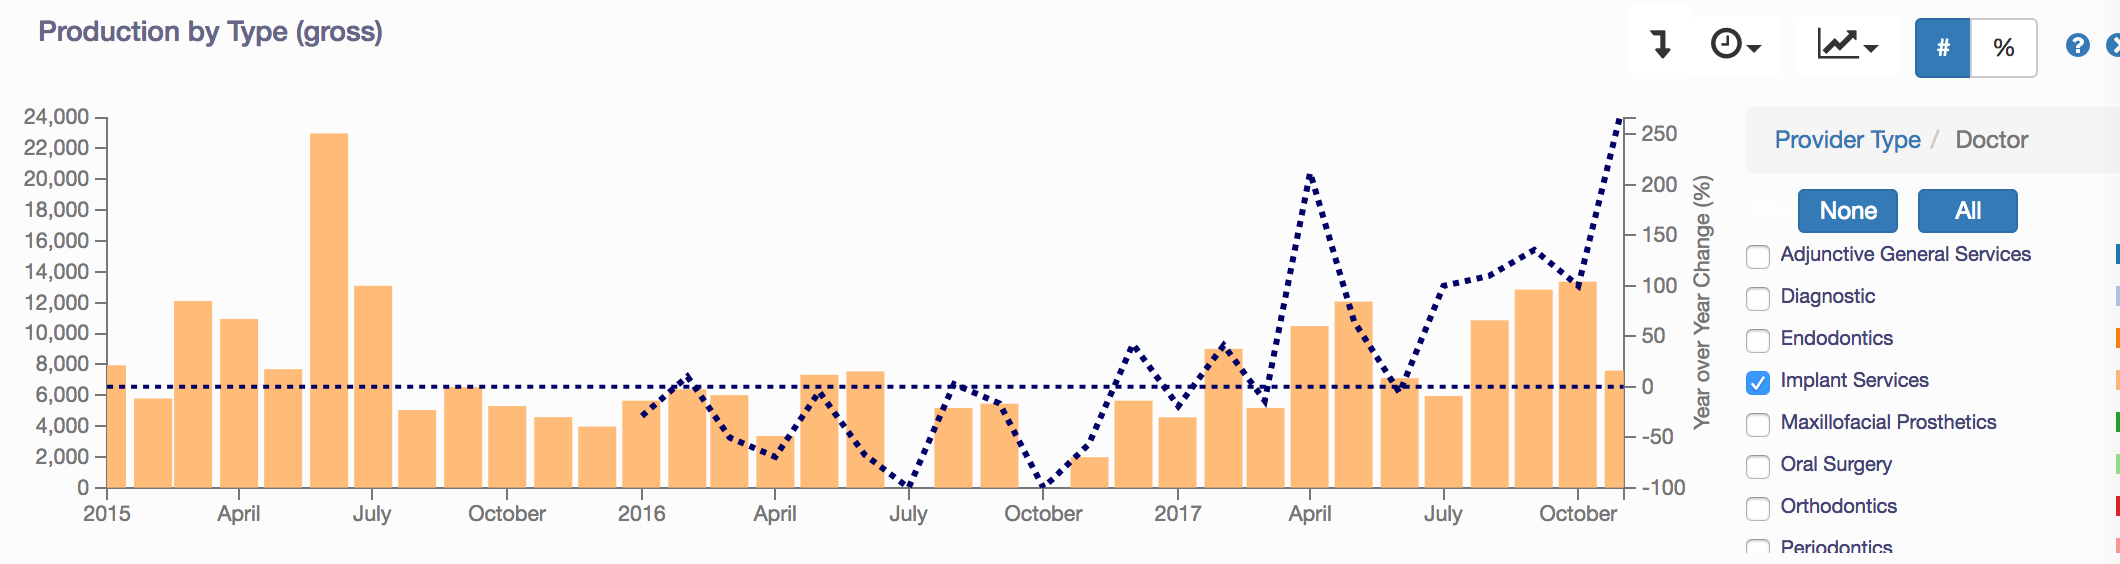
How to analyze procedure trends
With a few clicks, you can see the practice trend of what procedures are being done more (or less). Go to the Financial dashboard and select the Production Detail section. The top panel is the Production by Type(gross) panel. An example of a trend to look at might be how many implants are being placed.
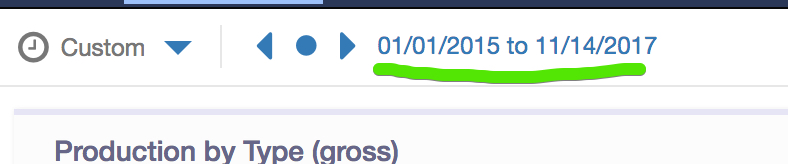
First, change the Time Period to a Custom date that begins with a previous year.
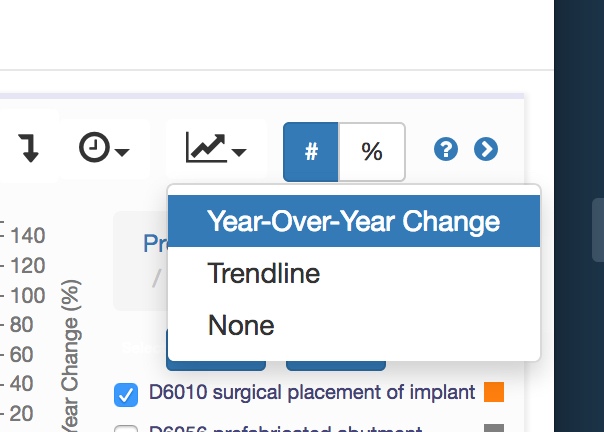
Then to check on implants you would just have a Doctor selected for the Provider Type. Clicking on any of the bars will drill it down to Service Types. Deselect all except for Implant Services. Clicking on any bar will drill the panel down to the Service Code. For placement, deselect all except for D6010 (surgical placement of implant). Selecting the drop-down arrow to the right or the graph icon will give you an option of overlaying a Year-Over-Year visual.
If the line is above the horizontal line it means more implants were placed that month vs the previous year. Clicking on any bar will show the dollar amount done for that month in the code or codes you selected.