- Help Center
- Enterprise Pages
- Enterprise Dashboards
-
Getting Started
-
Users and Login Information
-
Templates and Messages
-
Schedule and Online Appointment Booking
-
Patient Information
-
Online Forms
-
Reputation
-
Practice IQ
-
Revenue IQ
-
Tasks
-
Phone IQ
-
Marketing IQ
-
Patient Flow
-
Payments
-
PBN Settings
-
Enterprise Pages
-
Eaglesoft Best Practices
-
Open Dental Best Practices
-
Dentrix Best Practices
-
Product Releases
-
Known and Resolved Issues
-
Additional fees and overages
-
PBN Apps
-
Insurance Verification
-
FAQ's
-
Patient Portal
Enterprise Features (Home page)
See multiple practice KPIs from the same Practice IQ page
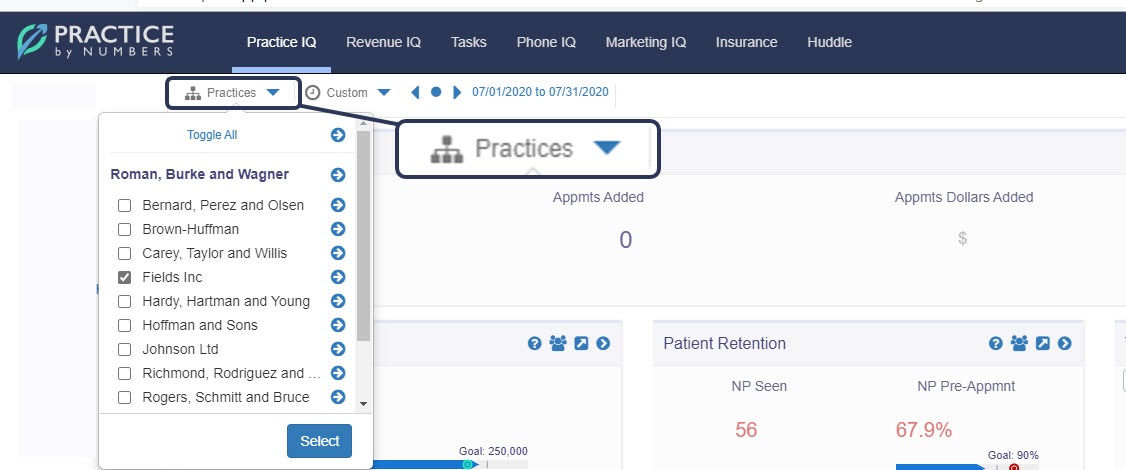
Select the offices from the drop-down menu adjacent to the Date Range to see KPIs for multiple practices. Only subscriptions with multiple offices and the proper User Account privileges will see this menu.

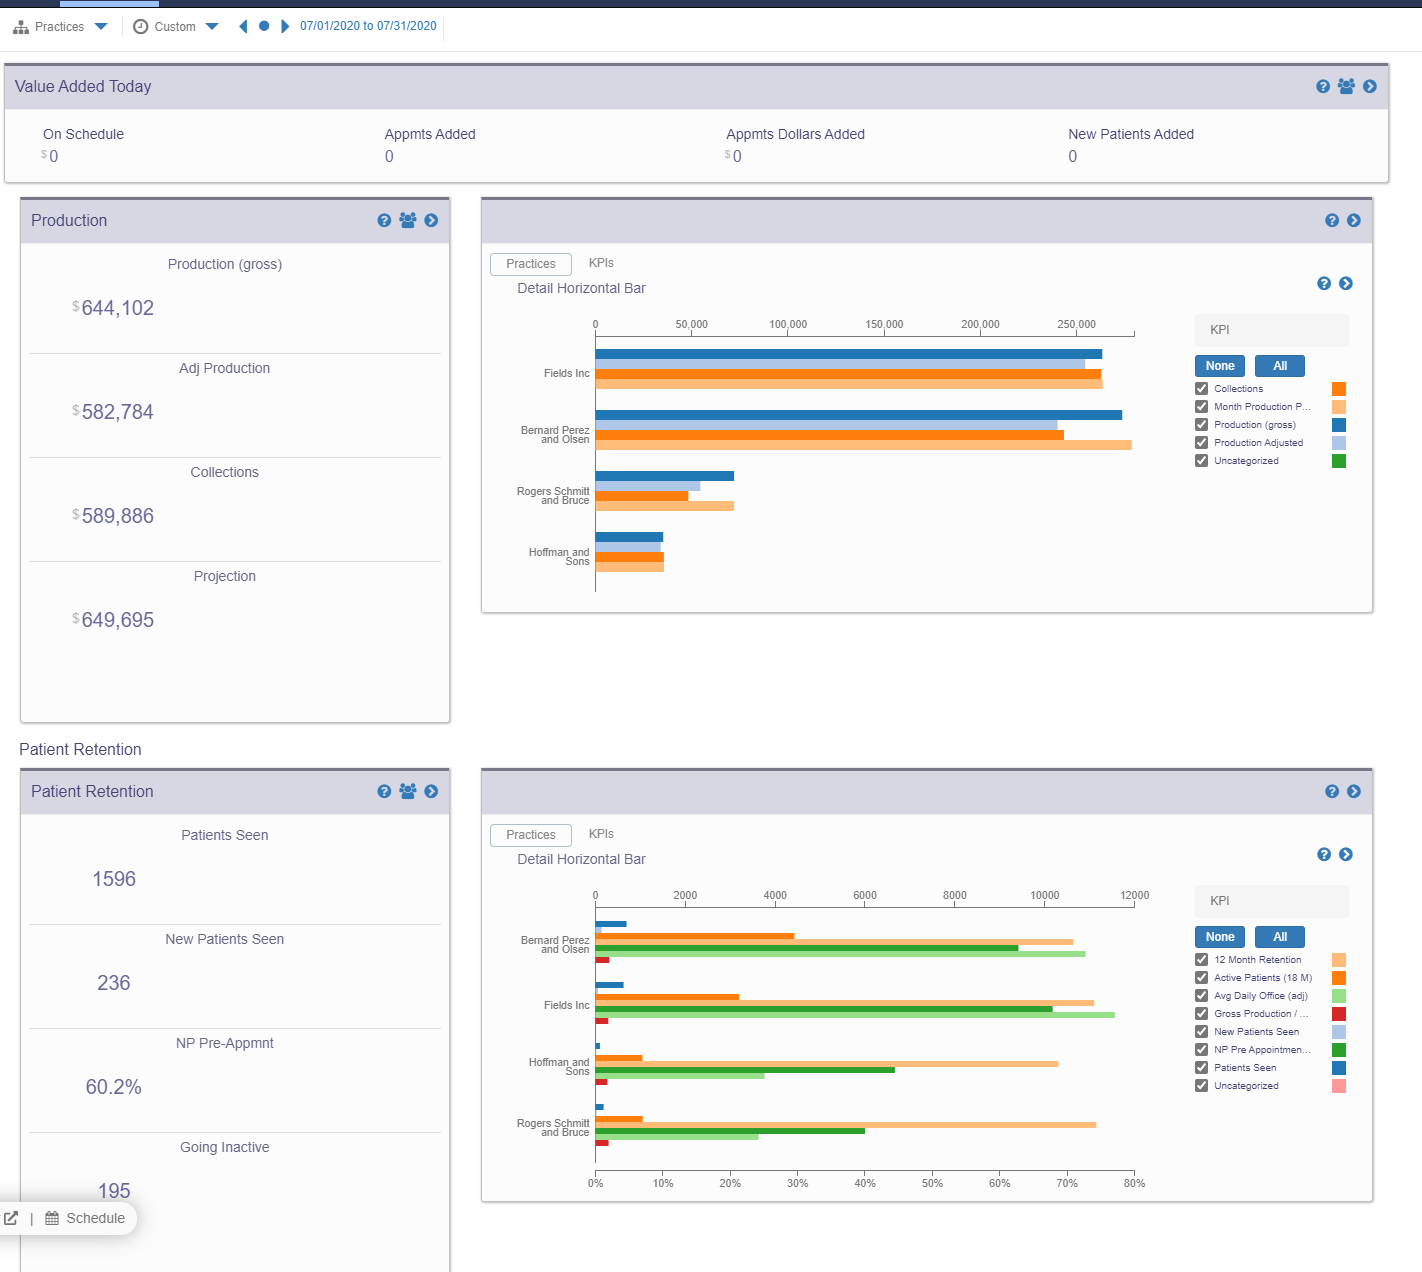
The page will refresh, and the Home page format will change to an appearance like in the image below.

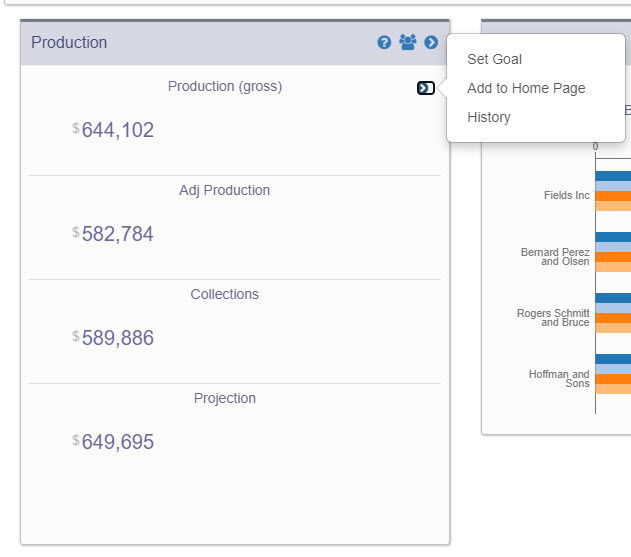
The panels on the left will show the totals of the practices chosen in the menu. Selecting the History option of a KPI will display a graph that can show the total overtime or display the offices individually.


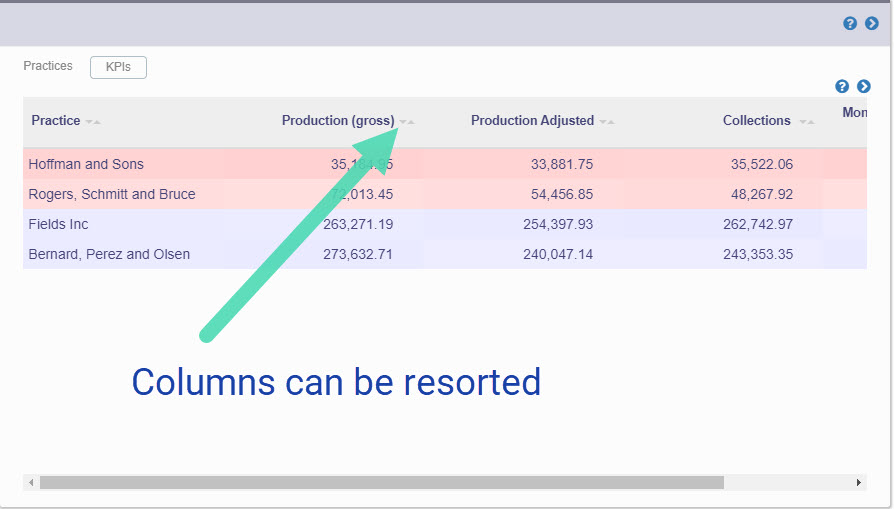
The graphs to the right will show the office's main KPIs and the numbers in a table format with color-coded columns. The top performing offices out of the ones selected will have a more violet hue, whereas the lower ones will have a reddish hue. The order of the rows can also be rearranged by the value of a particular column.
